Fixed-fee pricing
Get your carbon assessment quote
View pricing →Table of Contents
The carbon travel hierarchy is a simple way to decide how to make a journey with the least climate impact. It ranks the options, from not travelling at all down to flying, so that the lowest-carbon choice that still gets the job done is always the default. It is also known as the sustainable travel hierarchy or sustainable transport hierarchy, and the three terms describe the same idea.
For a business, the hierarchy is more than a poster on the wall. Business travel typically sits in Scope 3 Category 6 of a carbon footprint, and in the assessments we run it often makes up 15 to 20% of a client's total Scope 3 emissions. Using the hierarchy to shape a travel policy is one of the most direct ways to bring that number down. This guide explains all seven tiers, the emissions behind each one, and how to make the framework measurable.
What is the carbon travel hierarchy?
The carbon travel hierarchy ranks modes of travel from lowest to highest carbon impact. You work down it in order: avoid the journey where you can, then choose the lowest-carbon mode that still meets the need, and only reach for high-carbon options like flying when there is no realistic alternative.
The version below uses seven tiers, from avoiding travel at the top to air travel at the bottom. Some organisations use a shorter five-tier model, but the ordering is always the same: the least emissions-intensive option comes first.
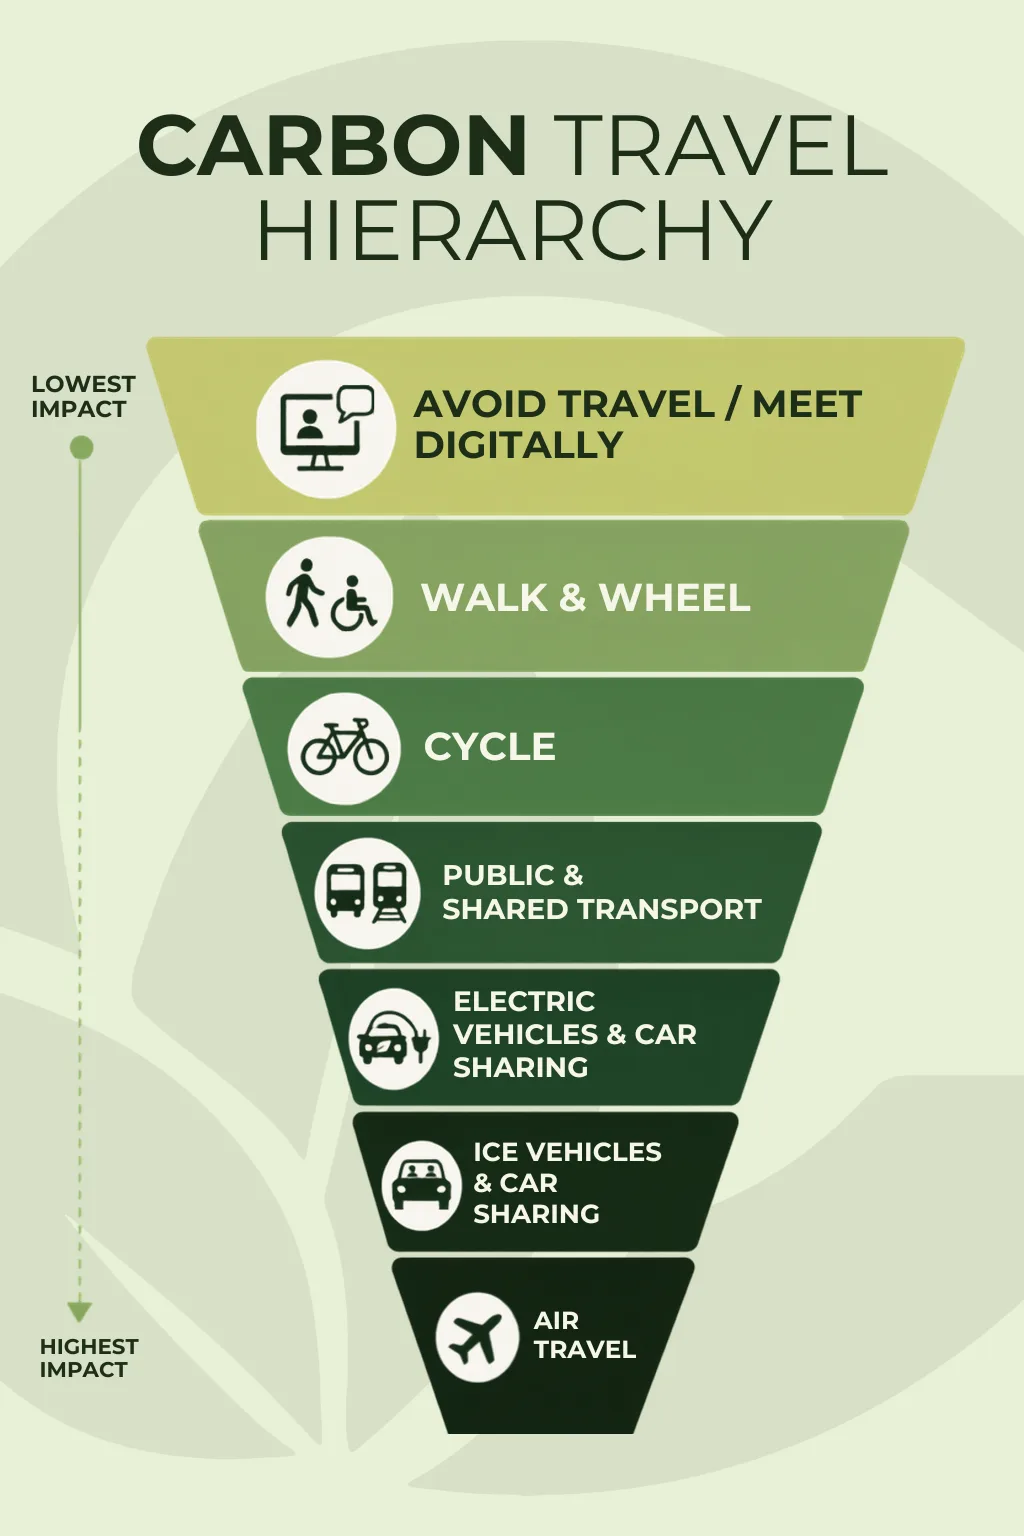
The seven tiers explained, from lowest to highest impact
1. Avoid travel and meet digitally
The lowest-carbon journey is the one that never happens. Before booking anything, the first question is whether the trip is needed at all. A video call, a shared document, or a phone conversation often achieves the same outcome with close to zero travel emissions. This tier is the most powerful lever in the whole hierarchy, and it is the one most competitors gloss over. It will not replace every trip, some things genuinely need a physical presence, but treating digital as the default rather than the exception removes a surprising share of business travel.
2. Walk and wheel
For short journeys, walking and wheeling (the term that includes wheelchair users) produce no operational carbon at all. The Energy Saving Trust estimates that every mile walked instead of driven saves around 276g of CO2. For town-centre meetings and short hops between sites, active travel is almost always the lowest-impact option, with health and cost benefits alongside.
3. Cycle
Cycling sits just below walking because it needs a little equipment, a bike and a helmet, but it still produces no direct emissions and covers longer distances comfortably. For commutes and local business trips of a few miles, it is one of the most practical low-carbon options a workforce has.
4. Public and shared transport
When a journey is too far to walk or cycle, buses, trams, and especially trains are the next best choice. Sharing a vehicle spreads its emissions across many passengers, so the per-person figure drops sharply. UK rail is one of the lowest-carbon motorised options available, which is why it should be the default for intercity business travel.
5. Electric vehicles and car sharing
Where a car is genuinely necessary, an electric vehicle running on the UK grid produces far less carbon per mile than a petrol or diesel equivalent, and car sharing splits even that between occupants. A single-occupancy EV is not as low-carbon as a full train, but it sits well above conventional cars in the hierarchy.
6. Petrol and diesel vehicles
Conventional petrol and diesel cars come near the bottom. A single-occupancy petrol car is one of the higher-carbon ways to travel per passenger. If one has to be used, filling the seats through car sharing is the simplest way to cut the per-person impact, and it moves the journey up a tier in practice.
7. Air travel
Flying sits at the very bottom of the hierarchy. It is the highest-carbon option per passenger for most journeys, and aviation carries an additional warming effect at altitude, known as radiative forcing, that ground transport does not. Air travel should be the last resort, reserved for journeys where distance or time genuinely rules everything else out. A London to Edinburgh flight, for example, has roughly eight times the carbon impact of the same trip by train.
Carbon impact by travel mode
The figures below are approximate emissions per passenger-kilometre, based on the UK government's greenhouse gas conversion factors. They are illustrative, actual emissions vary with occupancy, vehicle, and route, but they show clearly why the hierarchy is ordered the way it is.
| Travel mode | Approx. gCO2e per passenger-km | Notes |
|---|---|---|
| Walking / cycling | ~0 | No operational emissions |
| Eurostar (international rail) | ~4 | Low-carbon grid, high occupancy |
| Coach | ~27 | Emissions shared across many seats |
| National rail | ~35 | Default for intercity business travel |
| Local bus | ~100 | Lower occupancy than rail or coach |
| Petrol car (single occupant) | ~170 | Falls sharply when seats are shared |
| Domestic flight | ~250 | Highest per-passenger, plus radiative forcing |
The pattern is consistent: sharing a vehicle and avoiding flight are the two biggest levers. A full car of four people, for instance, produces roughly a quarter of the per-person emissions of the same car with one occupant.
How the travel hierarchy fits into Scope 3 carbon reporting
The hierarchy is more than good practice. It maps directly onto how carbon footprints are measured. Under the GHG Protocol, business travel is Scope 3 Category 6 and employee commuting is Category 7. Every choice you make on the hierarchy changes a number that appears in your report.
Move a client meeting from a flight to a video call, and Category 6 falls. Shift a workforce from single-occupancy driving towards rail and car sharing, and both Category 6 and Category 7 improve. Because these categories are measured with the same UK government conversion factors that sit behind the table above, the hierarchy and the carbon accounting are two views of the same thing. If you are new to how footprints are structured, our guide to business carbon footprints covers the Scope 1, 2, and 3 foundations first.
One point worth stressing: the hierarchy puts offsetting nowhere. Buying carbon offsets to compensate for a flight is a last resort that sits outside the hierarchy entirely, after every chance to avoid or reduce the emission has been taken. Reducing the journey always beats paying for it after the fact.
Building a business travel policy around the hierarchy
The hierarchy becomes useful when it turns into a policy people follow. A workable travel policy built on it usually includes:
- Digital by default. Ask staff to justify why a trip cannot be a video call, rather than justify the call.
- Rail before domestic flights. Make rail the required option for domestic and near-continental journeys, with flights needing sign-off.
- Share the vehicle. Encourage car sharing and public transport over single-occupancy driving, and prioritise electric hire vehicles where a car is needed.
- Measure before and after. Record travel data consistently so you can show the policy is working, not just assert that it is.
That last point is where most policies fall down. Without measurement, you cannot tell whether the policy changed anything, and you have nothing to put in a Carbon Reduction Plan or ESG disclosure. A carbon footprint assessment captures your business travel and commuting emissions in a defensible form, so the reductions your travel policy delivers show up as a real, reportable change year on year.
Frequently asked questions
Want to measure and cut your business travel emissions?
The Carbon Stamp provides expert carbon consultancy for UK businesses, from carbon footprinting to Carbon Reduction Plans, SECR reporting and ISO 14068 certification.