Included with every assessment, no extra cost

    Your carbon footprint, beautifully presented, and assured by us

    One clean, shareable dashboard for your whole emissions story.

    Every Carbon Stamp client gets a branded, independently assured dashboard showing their Scope 1, 2 & 3 emissions, year-on-year progress and path to net zero. Share it on your website, send it to procurement, and let your assured numbers do the talking.
    app.thecarbonstamp.com/dashboard
    The Carbon Stamp
    Measured & assured

    Carbon footprint dashboard

    Riverside Manufacturing

    Reporting year 2025Manufacturing
    Total emissions

    1,285

    tCO₂e

    vs baseline

    -12.4%

    2023

    Intensity

    18.4

    tCO₂e/£M

    Net zero

    2040

    target

    Emissions by scope

    GHG Protocol Scope 1, 2 & 3

    Scope 1312 t
    Scope 2184 t
    Scope 3789 t

    Illustrative example, every dashboard carries your branding and your assured data.

    A closer look

    Built to be understood at a glance

    Clear hierarchy, plain-English labels and purposeful colour, so anyone, from a buyer to your board, gets the picture in seconds.

    …/emissions-by-scope

    Emissions by scope

    GHG Protocol Scope 1, 2 & 3

    Scope 1312 t
    Scope 2184 t
    Scope 3789 t

    Scope 1, 2 & 3 at a glance

    Fixed colours so each scope is instantly recognisable.

    …/top-sources

    Top emission sources

    Largest contributors to your footprint

    Your biggest hotspots, ranked

    Know exactly where to focus reduction effort first.

    …/net-zero-trajectory

    Carbon reduction trajectory

    Progress towards net zero by 2045

    Progress toward net zero

    Actual emissions tracked against your target path.

    Want a dashboard like this for your business?

    It comes with every assessment. Book a free 30-minute discovery call to get started.

    Live & published

    See a real client dashboard

    Real, published dashboards from Carbon Stamp clients. Open one, this is exactly what yours would look like, your branding and your assured data.

    app.thecarbonstamp.com/dashboard
    NHS supplier · HealthcareMeasured & assured

    Medicom Healthcare

    An NHS healthcare supplier's full Scope 1, 2 & 3 footprint, measured and presented for procurement and tender requirements.

    app.thecarbonstamp.com/dashboard
    Wholesale & retailMeasured & assured

    Addis Housewares

    An established housewares brand sharing its measured carbon footprint transparently across wholesale and retail operations.

    Read more client success stories to see how businesses use their assured dashboards.

    The basics

    What is a carbon dashboard?

    A carbon dashboard is a shareable web page that presents a company's measured greenhouse gas emissions, its carbon footprint, in one clear, visual format. Instead of a static PDF buried in a folder, it's a live link that shows your total emissions in tonnes of CO₂e, how they break down, and how they're changing over time.

    The Carbon Stamp dashboard is generated from a full carbon footprint assessment and displays your Scope 1, 2 and 3 emissions, measured to the GHG Protocol methodology using UK Government (DEFRA) factors, including Scope 2 on both the market-based and location-based methods , and independently assured by The Carbon Stamp.

    Because it updates each time you reassess, the dashboard also becomes a simple way to evidence progress against your carbon reduction plan and prove year-on-year cuts to buyers. For a wider look at how UK SMEs present and report emissions data, see our guide to the best carbon reporting solutions.

    A live, hosted web page on a permanent link, not a one-off PDF.

    Shows Scope 1, 2 & 3 emissions, top sources, trends and net-zero progress.

    Measured to the GHG Protocol and independently assured by a third party.

    Built to be shared, on your website, in tenders, and with customers.

    What's on every dashboard

    Everything a buyer, auditor or customer wants to see, measured to the GHG Protocol and presented in plain English.

    Scope 1, 2 & 3 breakdown

    A clean donut and per-scope disclosure showing exactly where your emissions sit across all three GHG Protocol scopes.

    GHG Protocol dual reporting

    Scope 2 shown on both the market-based and location-based methods, so your footprint stands up to procurement and auditor scrutiny.

    Top emission sources

    Your biggest contributors ranked at a glance, plus a full category-by-category breakdown with percentage of total.

    Year-on-year trend

    Track emissions over time with scope comparison and total-trend charts, proof of progress, not just a single snapshot.

    Net-zero trajectory

    Your actual emissions plotted against a linear path to your net-zero target year, so reductions are visible and credible.

    Emissions intensity

    Normalised metrics, tCO₂e per £M revenue or per tonne of output, that let you benchmark performance fairly as you grow.

    How you get yours

    From assessment to shareable in three steps

    1

    We assess your footprint

    We calculate your full Scope 1, 2 and 3 emissions using GHG Protocol methodology and the latest DEFRA factors, guided, fixed-fee, no jargon.

    2

    We build your dashboard

    Your assured results are turned into a branded, shareable dashboard, your logo, your sector, your reporting year. No extra cost, no setup on your side.

    3

    You share it everywhere

    Link it on your website, drop it into tenders, send it to customers. As you reassess each year, the trend and net-zero trajectory build automatically.

    The dashboard is included, free, with every assessment

    No subscription, no add-on fee, the shareable, assured dashboard comes as standard with every carbon footprint assessment. See pricing for assessment costs.

    Real Partnerships, Real Results

    See us in action with our clients. These aren't stock photos - they're real moments from our actual partnerships, showing the tangible impact we deliver together.

    Brand with reach or a strong sustainability story? We occasionally partner on price, mention it on your scoping call and we'll explore it together.

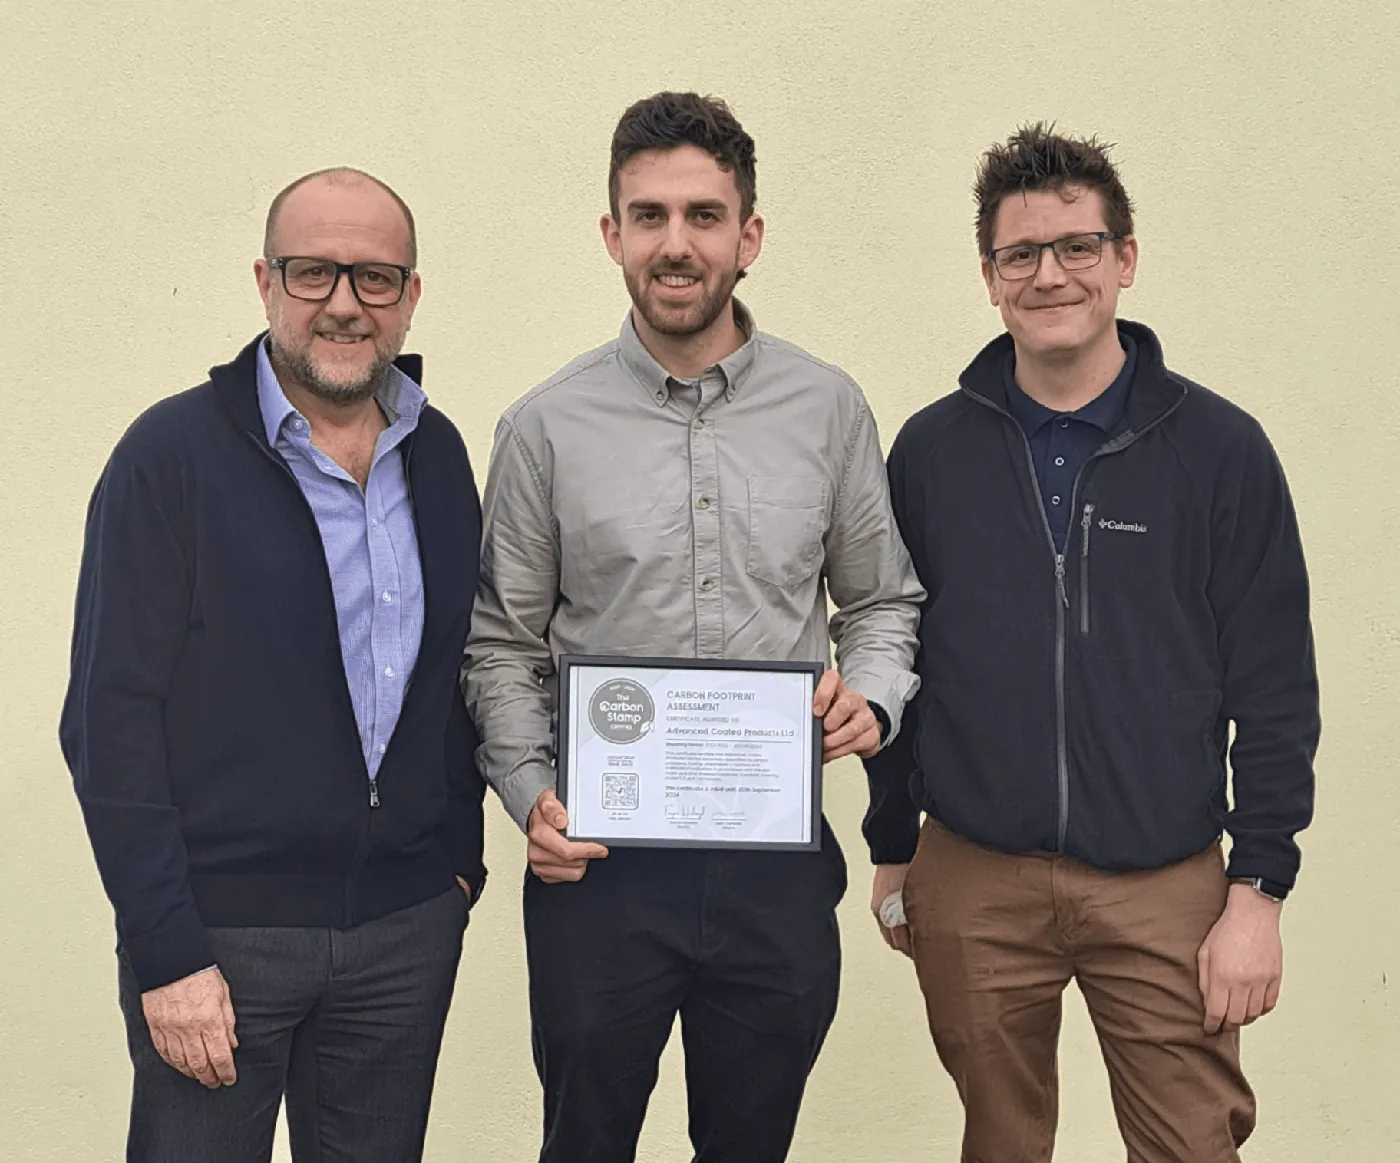
    Manufacturing Excellence in Action

    Advanced Coated Products

    Our partnership with Advanced Coated Products showcases how manufacturing leaders can achieve carbon compliance without compromising operational excellence.
    Comprehensive carbon footprint assessment
    Manufacturing-specific emissions analysis
    Partnership certificate presentation
    Celebrating Advanced Coated Products' carbon assessment completion with their team

    Celebrating Advanced Coated Products' carbon assessment completion with their team

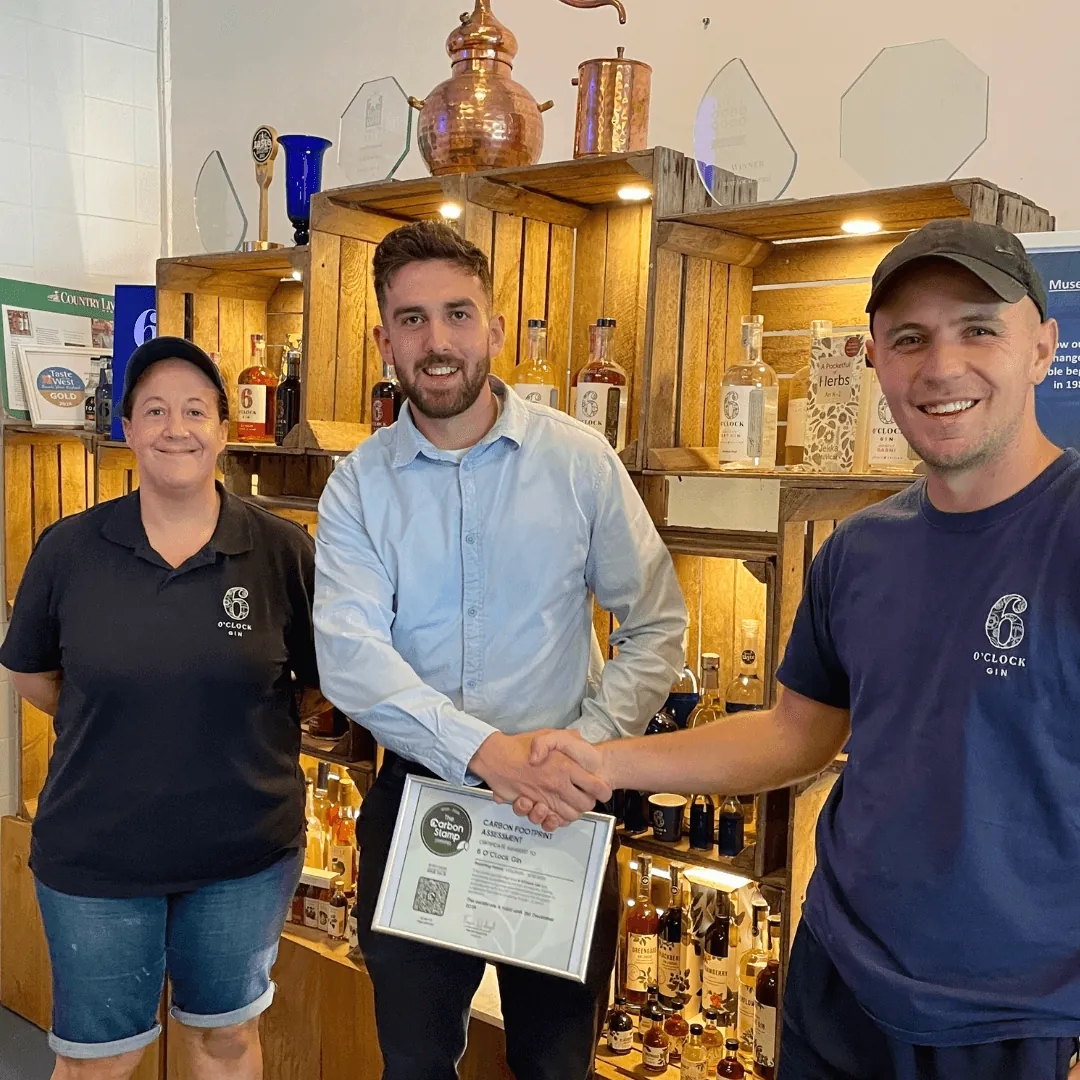
    Crafting Sustainability Excellence

    6 O'Clock Gin

    Working directly in their distillery environment, we delivered comprehensive carbon assessment tailored to craft spirits production.
    On-site assessment at distillery facility
    Production-specific carbon analysis
    Assured carbon assessment certificate
    Certificate presentation at 6 O'Clock Gin distillery - carbon footprint assessment completion

    Certificate presentation at 6 O'Clock Gin distillery - carbon footprint assessment completion

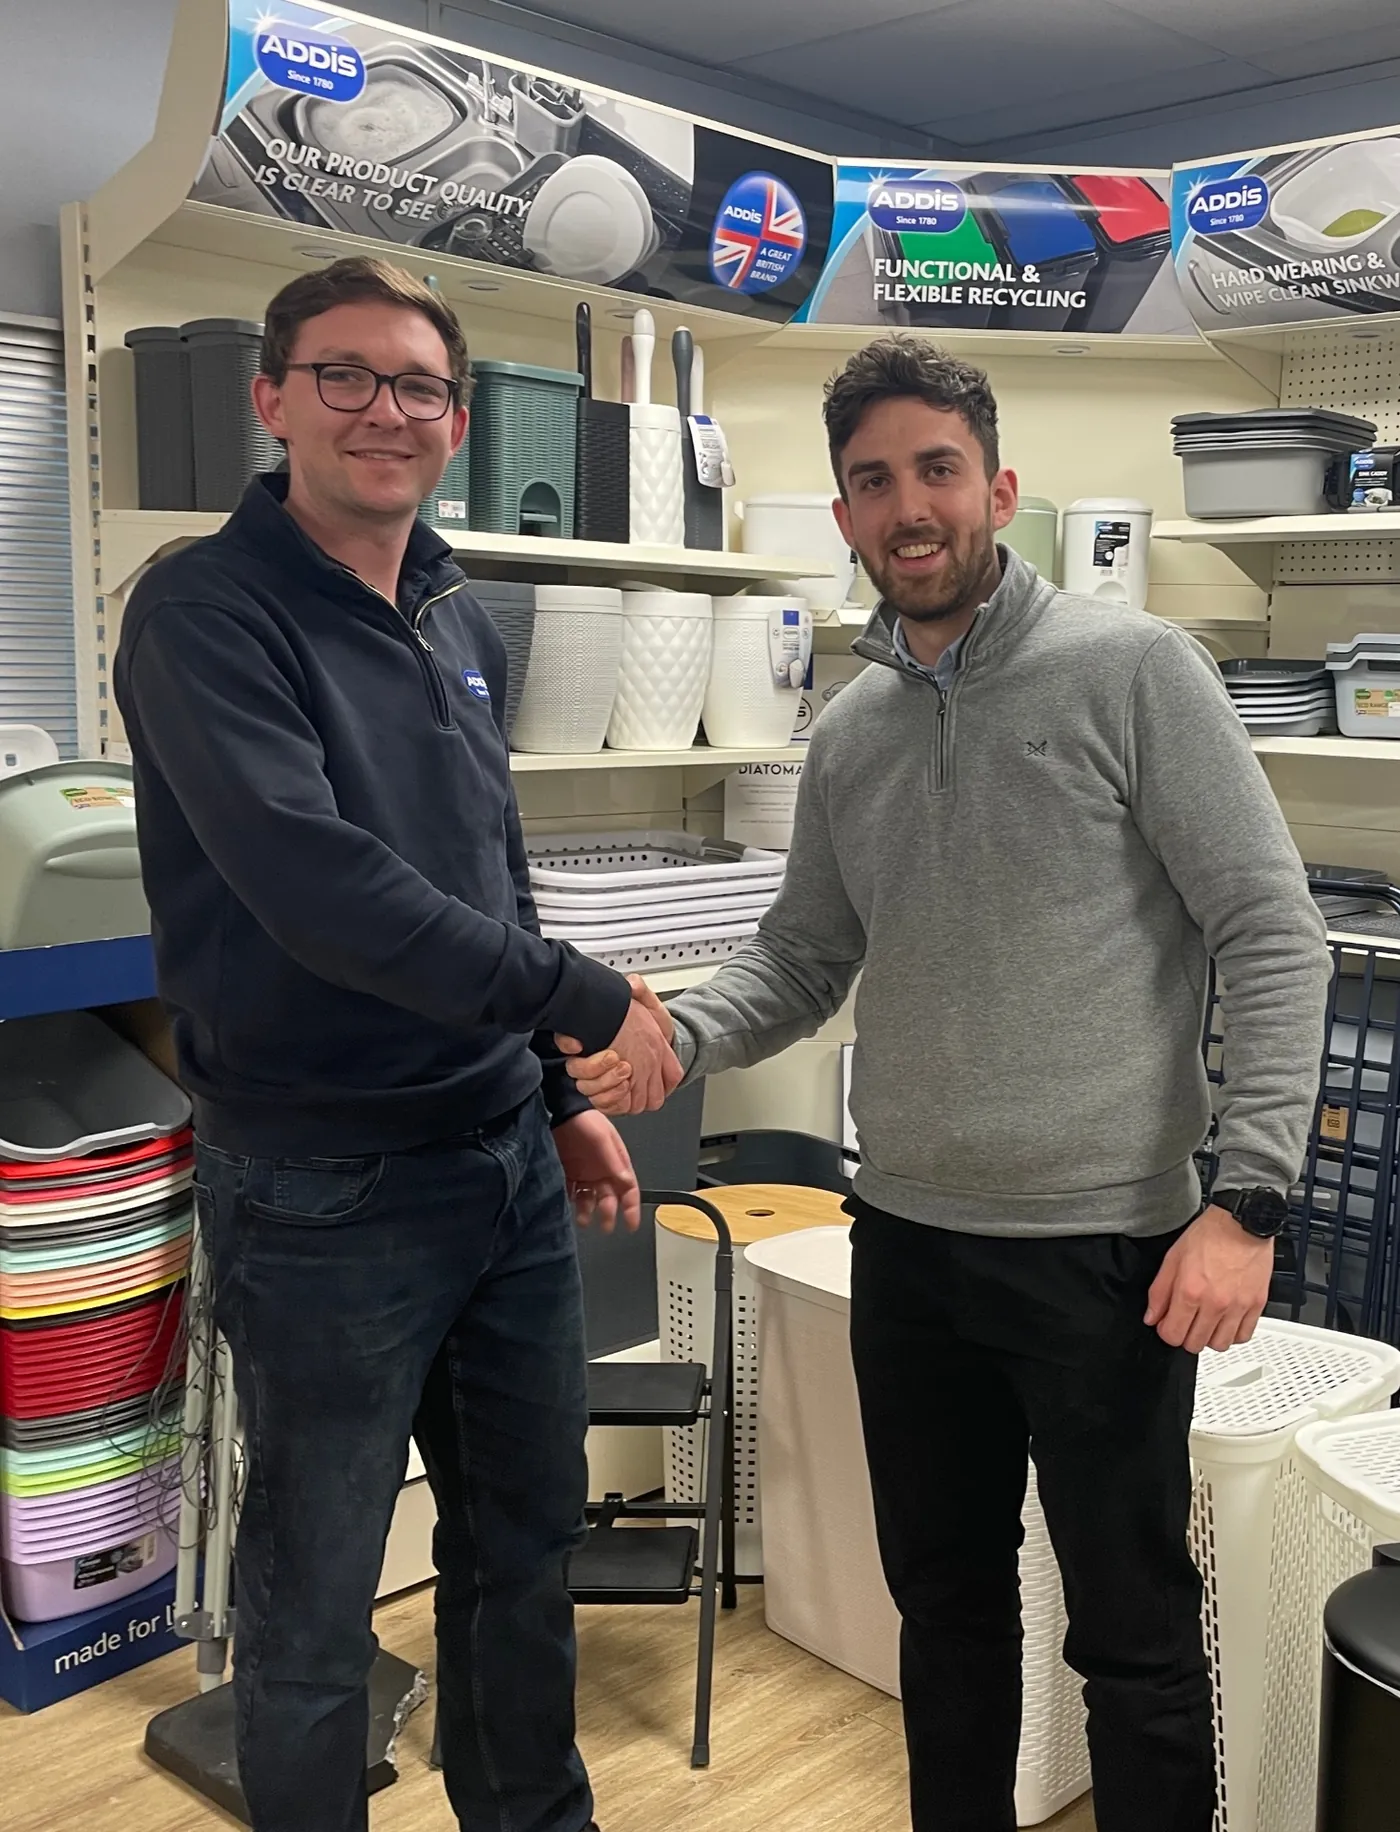
    Partnership in Action

    Addis Housewares

    Our collaboration with Addis demonstrates the power of expert guidance combined with genuine commitment to sustainability transformation.
    Face-to-face consultation and planning
    On-site assessment and data gathering
    Ongoing support and strategic guidance
    The Carbon Stamp team working directly with Addis leadership

    The Carbon Stamp team working directly with Addis leadership

    Frequently asked questions

    What clients ask about the carbon dashboard.

    It is a shareable, independently assured web page that displays your company's measured carbon footprint in one clean, simple format. It shows your total emissions, a Scope 1, 2 and 3 breakdown, your top emission sources, year-on-year trends, emissions intensity and your trajectory towards net zero. Every figure is measured by The Carbon Stamp and checked in an independent review, and the dashboard carries our assurance mark so buyers and customers can trust the numbers.

    The dashboard is included free with every carbon footprint assessment, there is no separate subscription or add-on fee. When you commission an assessment with The Carbon Stamp, you receive your signed report, your supporting data, and your live dashboard as standard. Assessment pricing is on our pricing page.

    Yes, that is exactly what it is built for. You get a public link you can add to your website, sustainability page, email signature or tender submissions. Many clients feature it as their transparent, always-up-to-date proof of carbon measurement, which also drives interested visitors back to assured emissions data rather than vague green claims.

    It presents your total emissions in tCO₂e, a Scope 1, 2 and 3 donut and disclosure (with Scope 2 reported on both market-based and location-based methods per the GHG Protocol), a full category breakdown, your top emission sources, year-on-year scope and total trends, your emissions intensity (per £M revenue or per tonne of output), and a carbon reduction trajectory against your net-zero target year. If you are carbon neutral certified, it also displays your certificate and the offset projects you've invested in.

    Yes. Every dashboard is built from an assessment measured by The Carbon Stamp and independently reviewed, using GHG Protocol methodology and UK Government (DEFRA) conversion factors. The dashboard is branded "Measured & assured by The Carbon Stamp", which is what gives the figures credibility with procurement teams, auditors and customers, a software platform alone cannot provide that independent sign-off.

    Buyers, investors and customers increasingly want proof, not promises. An assured, public dashboard turns your carbon data into a competitive asset: it satisfies procurement and ESG questionnaires, replaces vague green claims with auditable figures, and helps you stand out from competitors who can only offer a buried PDF. Because it carries an independent assurance mark, it signals a credibility that a self-reported spreadsheet cannot, useful in tenders, on your website, and in every customer conversation.

    A spreadsheet sits in a folder and a software platform gives you raw data, neither carries independent sign-off. Your Carbon Stamp dashboard is measured by The Carbon Stamp and independently assured, presented in a shareable, always-up-to-date format, and carries our assurance mark. That independent assurance is what makes the numbers count for buyers, procurement teams and regulators.

    Yes. The dashboard is a hosted web page on a permanent link, not a static PDF. When you reassess your footprint each year, your new figures, year-on-year trend and net-zero trajectory update automatically, so anyone you've shared the link with always sees your latest assured data.

    The dashboard is built from a full carbon footprint assessment measured to the GHG Protocol using UK Government (DEFRA) conversion factors, covering Scope 1, 2 and 3. It is ideal for demonstrating assured emissions to procurement teams, including NHS suppliers and public-sector buyers. For formal PPN 006 tender submissions you also need a signed Carbon Reduction Plan, the dashboard complements that by giving buyers a clear, shareable view of your measured footprint.

    Book a free discovery call. We will scope your carbon footprint assessment, and once it's complete we build your dashboard and hand you the shareable link, usually within the same delivery timeline as your report. There is nothing to set up on your side and no extra charge for the dashboard itself.

    Get your assured carbon dashboard

    Book a free 30-minute discovery call. We'll scope your assessment and have your shareable, independently assured dashboard ready alongside your report.

    Included with every assessment.